Per-machine pricing, faster dashboards and honest weekly reports
October's Astara releases: simple per-machine pricing with unlimited users, history lookups up to thousands of times faster, and weekly production reports that never invent machine time.
October has been a busy month for Astara. Releases 4.41.0 to 4.41.2 change how Astara is priced, make the workspace noticeably faster on machines with long histories, and fix a reporting problem we think every manufacturer should care about: software that fills gaps in the data with time it never measured. Here is what changed and why.
One price per machine, everyone included
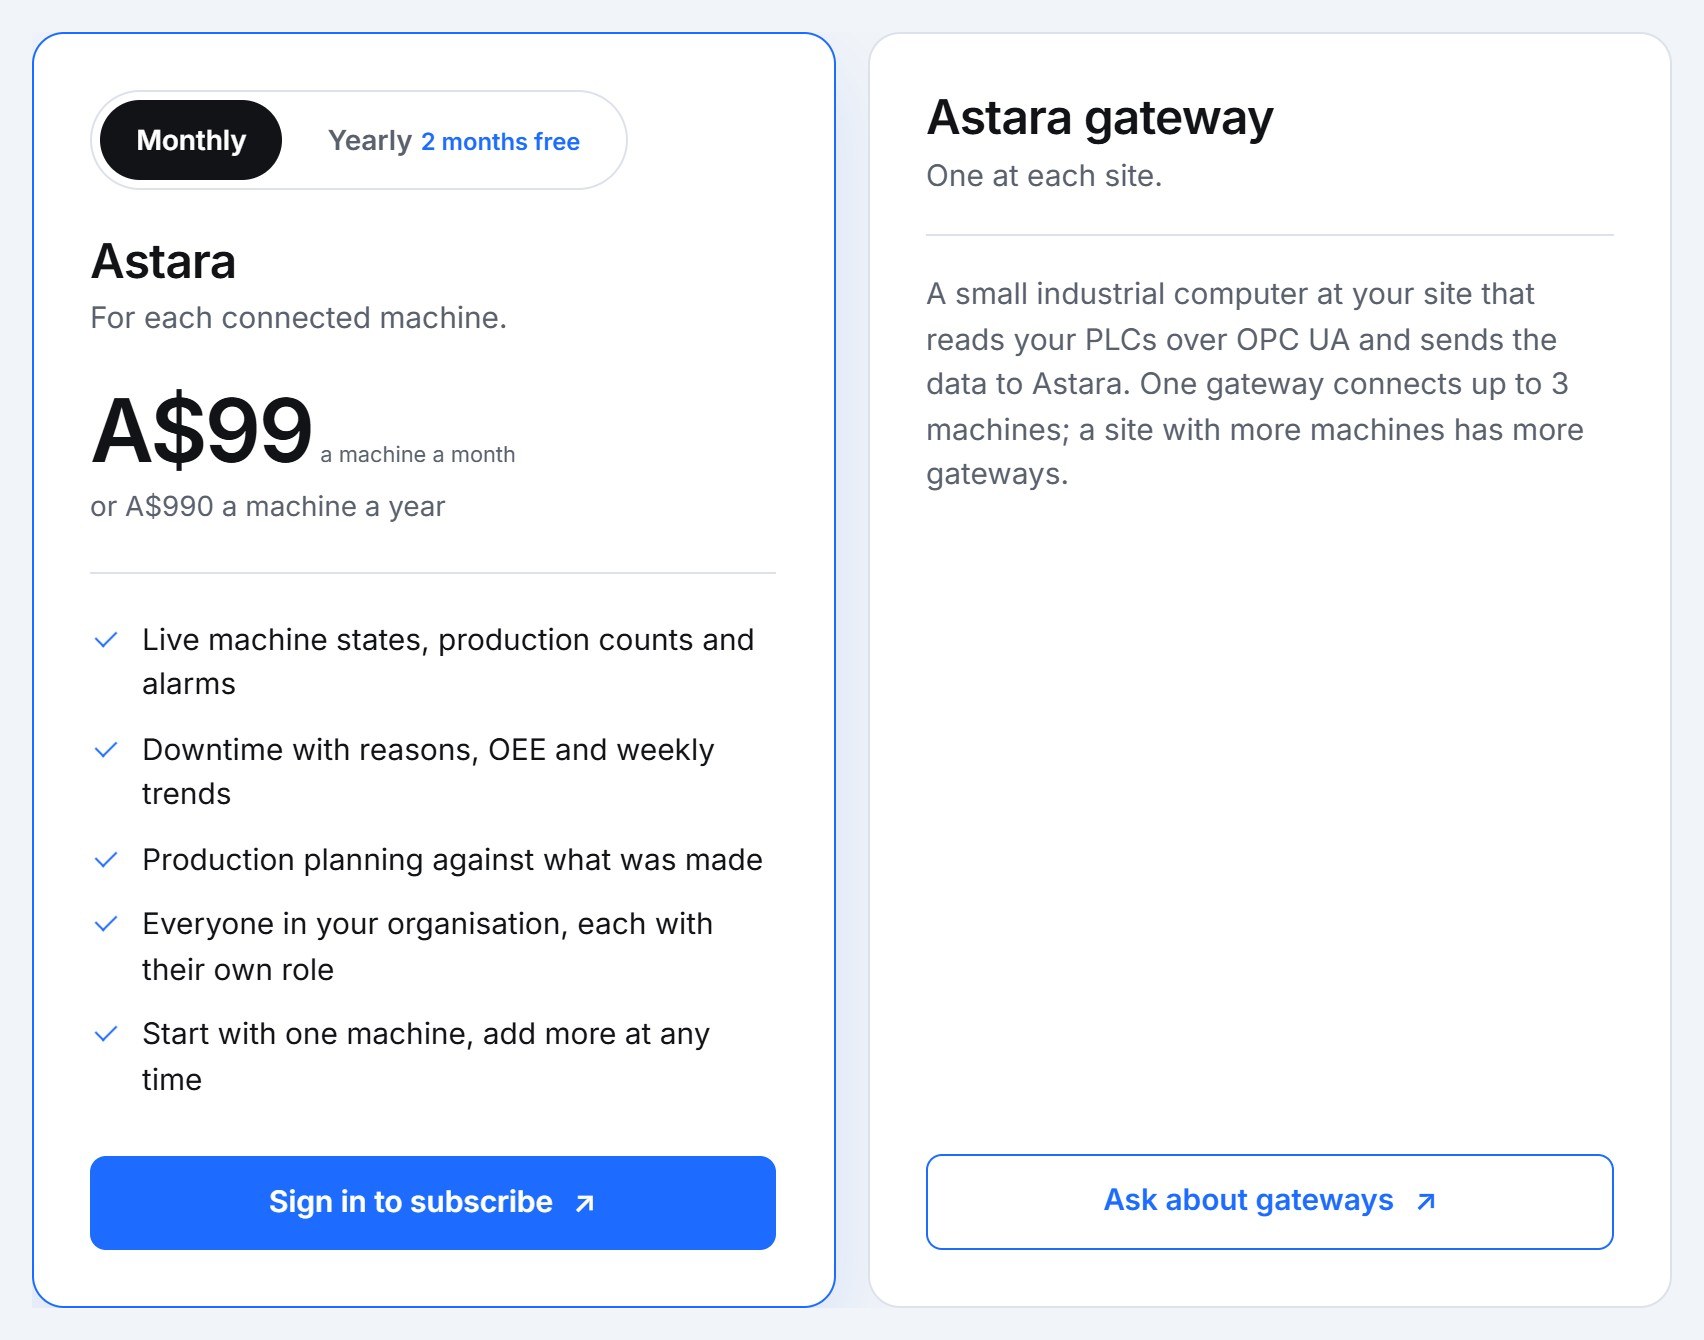
Astara is now billed per connected machine. Every person in your organisation is included: operators, supervisors, planners, maintenance and management. Prices are in Australian dollars, include GST, and can be paid monthly or yearly.
We chose per-machine pricing because it matches how manufacturers adopt machine monitoring. You start with the machine that costs you the most downtime, build a baseline you trust, then add the next one. Charging per user would have the opposite effect. It discourages the very people who should be looking at the downtime record, such as operators and maintenance technicians, from having an account.
- Organisation administrators manage the plan under Organisation → Plan and billing.
- Your machine limit follows the number of machines you pay for.
- A site can run several gateways, and each gateway collects from up to 3 machines.
Current prices and open offers are on the pricing page.
Weekly reports that never invent machine time
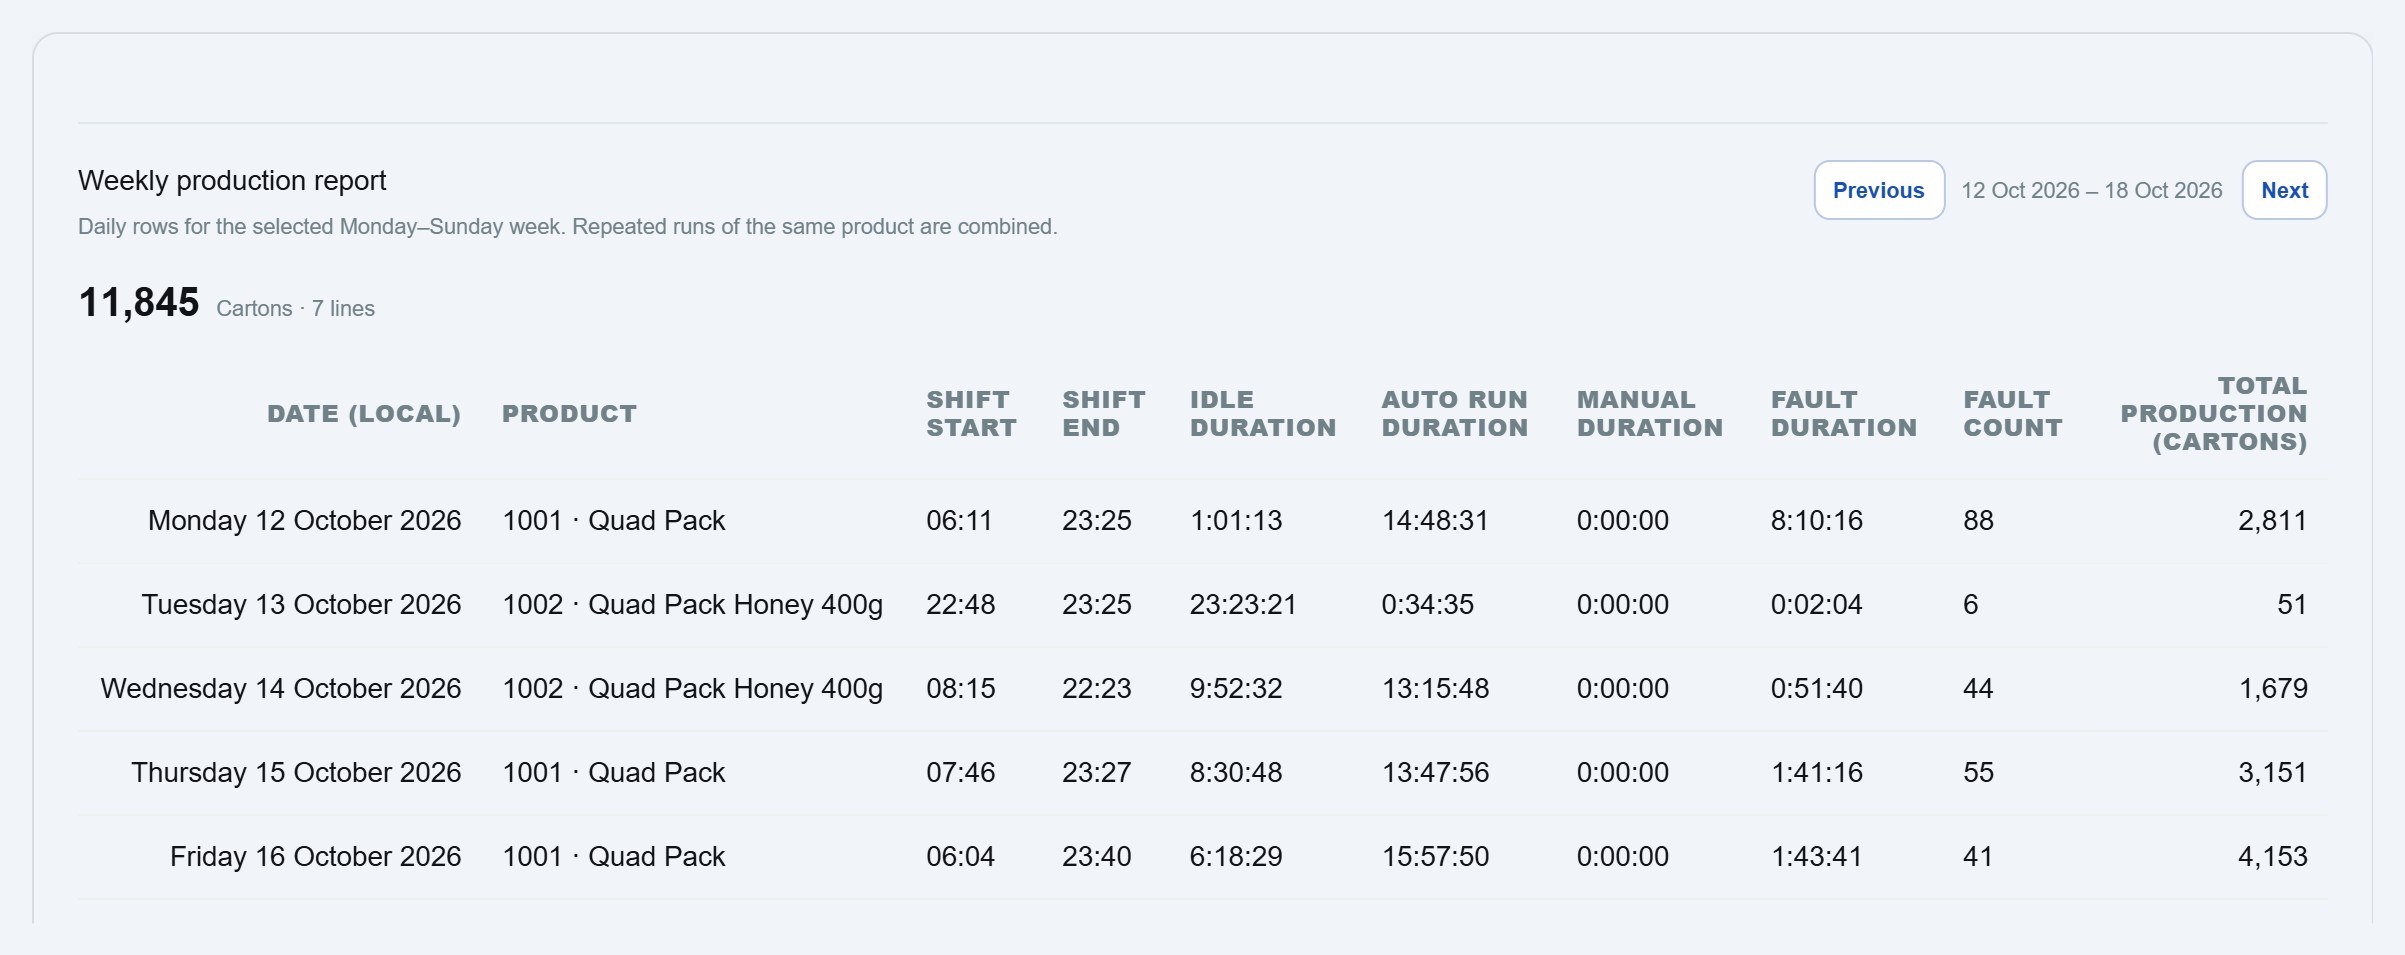
This is the change we are most pleased to have made. Previously, if a machine went quiet (its gateway lost power over a weekend, for example), the weekly production report carried the last known state forward. A machine last seen in Auto Run could show a full day of Auto Run that never happened, and a day with no evidence at all read as 24 hours of Idle.
Both are wrong, and both are the kind of error that quietly destroys trust in a downtime tracking system. Since 4.41.0:
- The last machine state stops at the last recorded evidence. It never runs on past it.
- Days with no evidence read No machine data recorded, not Idle and not Stopped.
- When evidence arrives after a gap, Astara recalculates the roll-ups back to the previous evidence (up to 31 days), so late data from a gateway that was offline lands in the right place.
- Overnight production gaps count as idle, and today's row covers only the shift so far.
This follows a rule that runs through all of Astara: time a machine could not be observed is unknown, never silently “stopped” or “running”. You can read more about how Astara treats machine states on the downtime tracking page.
Dashboards that stay fast as history grows
Machine monitoring data grows every minute. A dashboard that is quick in its first week can slow to a crawl after a year, because a careless query has to read the machine's whole history to find one value. In 4.41.2 we rewrote the lookups that find each machine's last reading before a time window so they go straight to the existing time indexes:
- The dashboard's previous evidence for each machine went from 560–970 ms per load to about 0.2 ms.
- The production roll-up that runs after every batch from the gateway went from 90–240 ms per lookup to about 0.1 ms, and the weekly fault timeline shares that speed-up.
- The Production page's earlier and latest readings use the same fast path.
The results are identical; only the time taken changed. No schema or data changes were needed.
A new public site, and this news page
Astara.au has a new design, with a page for each topic: features, how it works, the workspace and a FAQ. The solution pages now live under Features, for example machine monitoring and OEE. Old addresses redirect permanently. This news section, with its RSS feed, launched in the same release.
All of these changes are live. If you're comparing downtime tracking systems and want to see Astara on real production data, contact us.