How to reduce production line downtime: a 30-day plan
A practical 30-day plan to reduce production line downtime: measure stops from the machine, find the biggest losses, fix one at a time and prove the improvement with data.
Most downtime reduction programmes fail for the same reason: they start with solutions before anyone agrees on the problem. A new preventive maintenance schedule, a spare-parts kit or a retrained crew might all help, but without a reliable record of where the line loses time, you can't tell which one will. This 30-day plan starts with measurement and ends with a result you can prove.
Days 1–3: pick one line and one machine
Don't try to improve the whole plant at once. Choose the line that matters most commercially, and on it, the machine that limits output. On a packaging line that is usually the filler, the former or the case packer. Improving any other machine on the line won't raise output while the constraint stays where it is.
Days 1–14: measure, don't change
Collect two weeks of downtime data before you change anything. That gives you a baseline that covers both shifts, a weekend and the normal product mix.
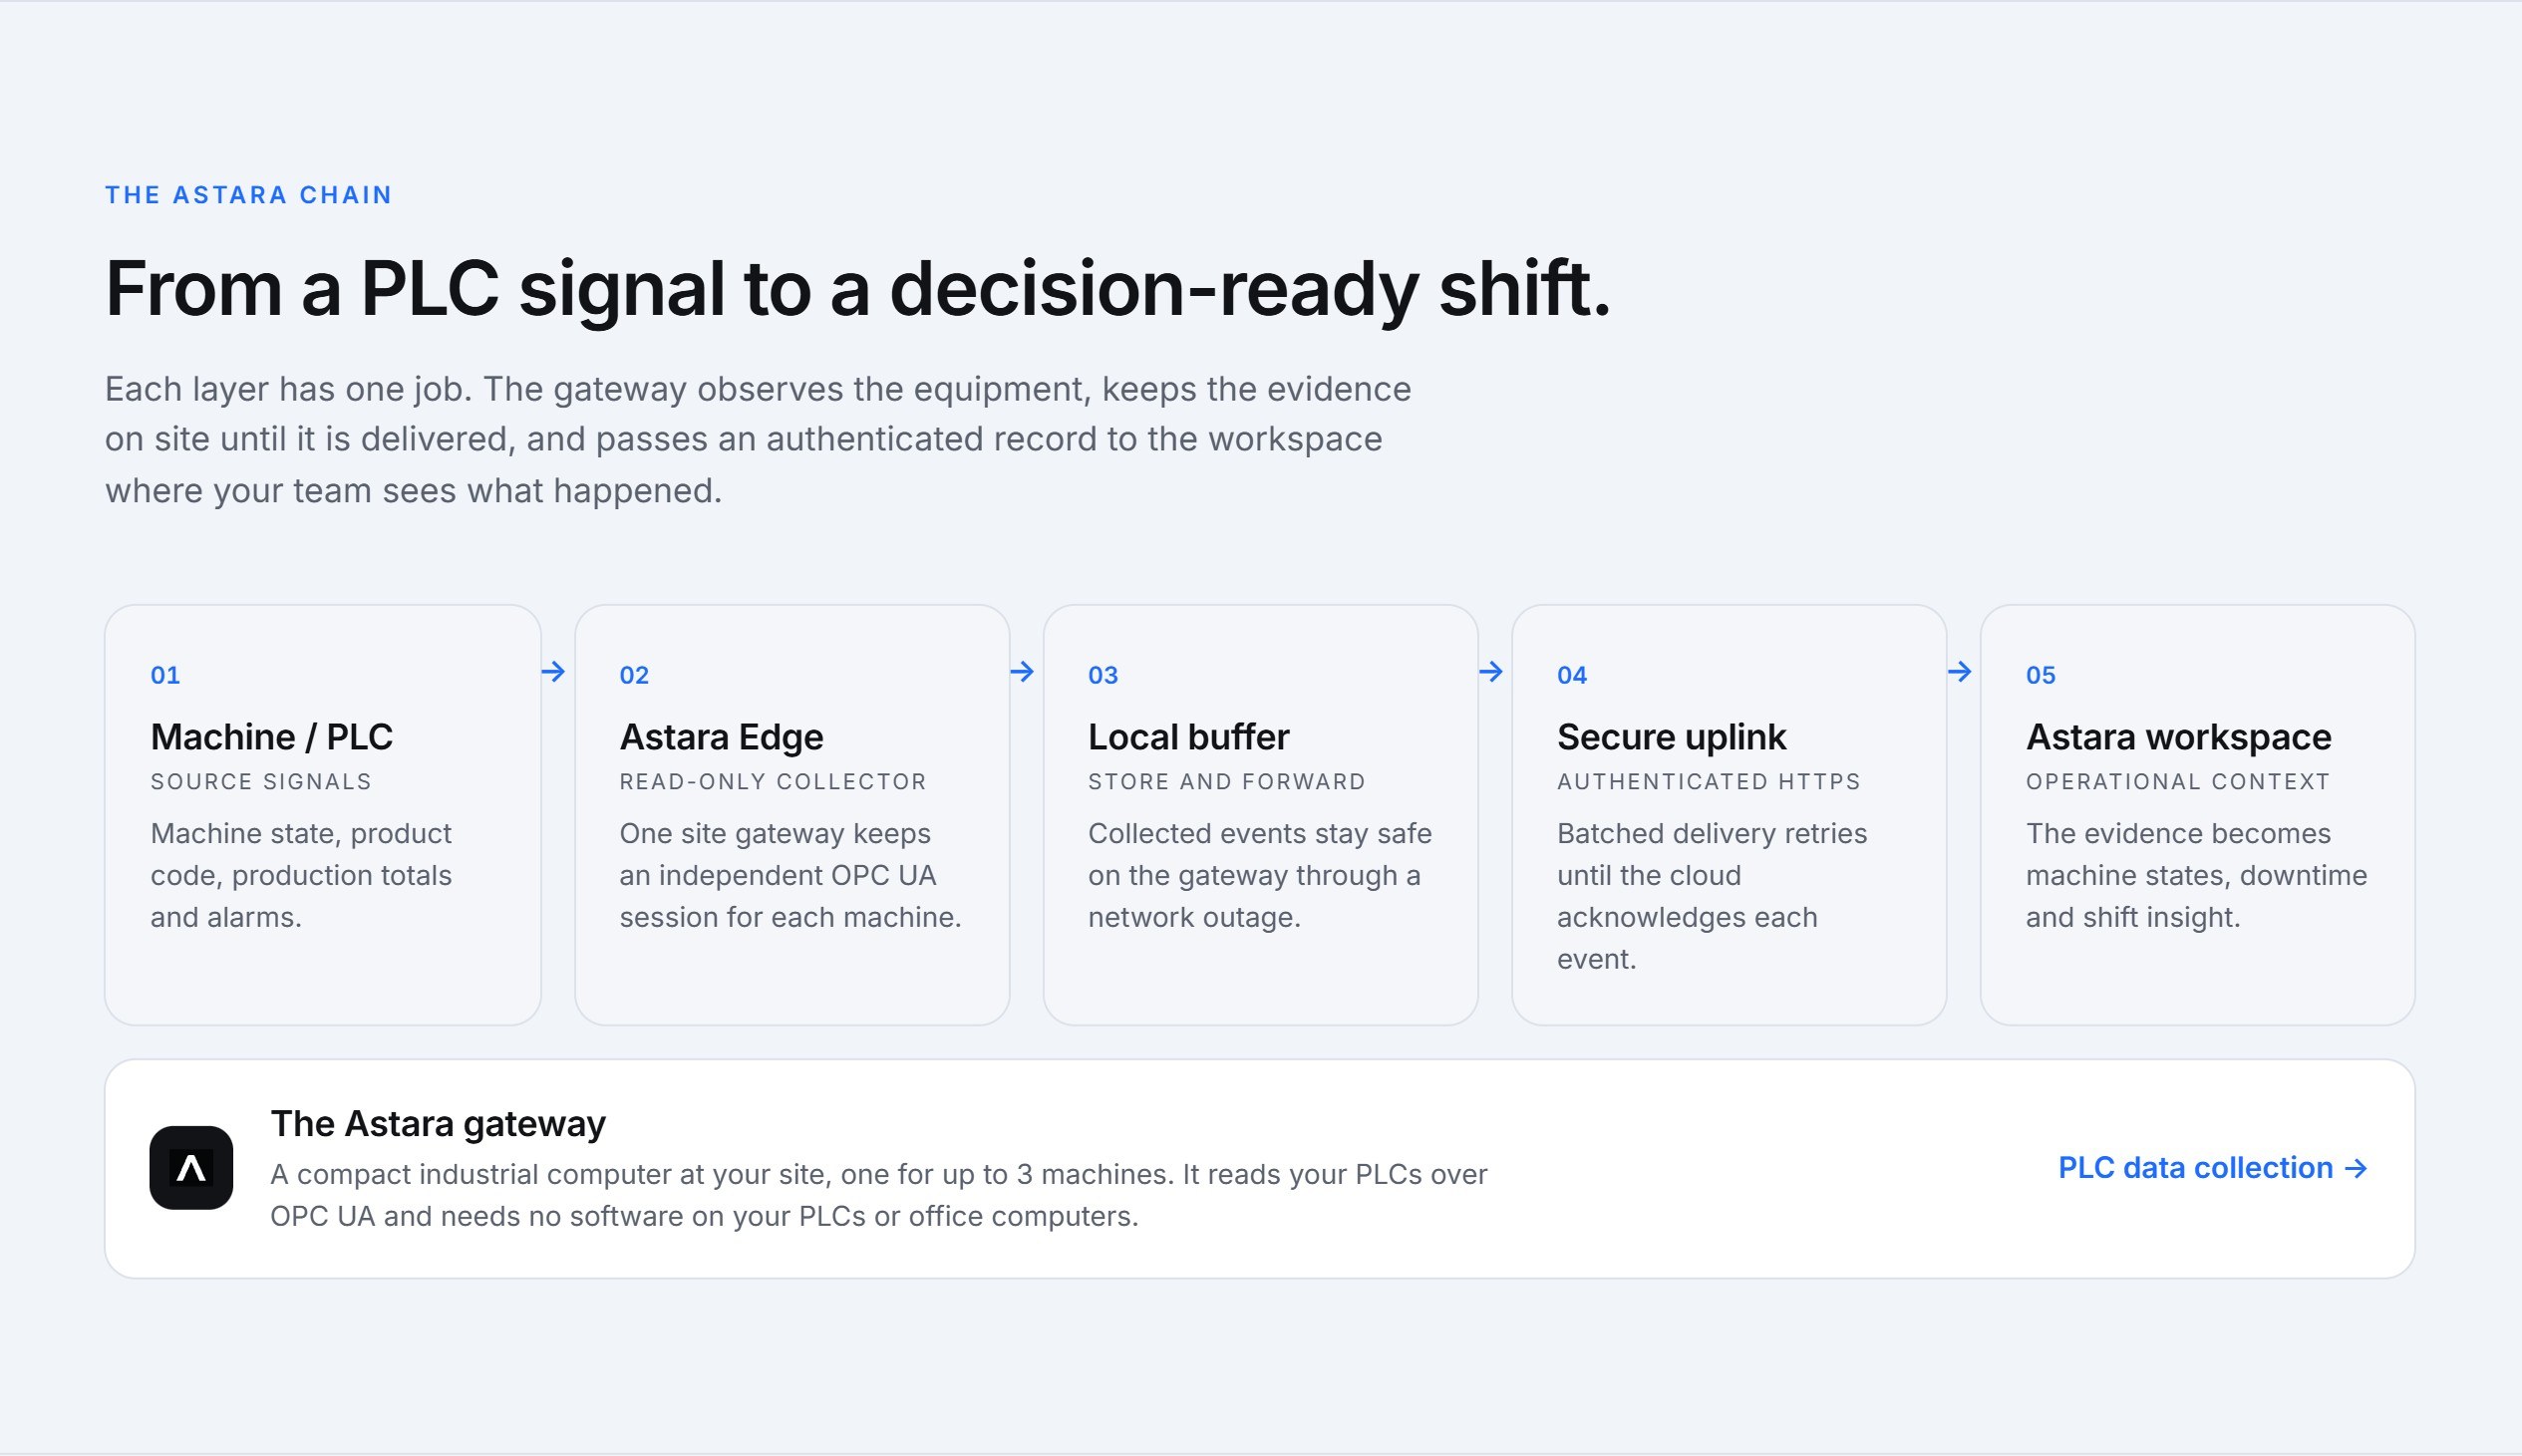
The data has to come from the machine. Manual logs miss short stops and round durations, which is why they so often point improvement effort at the wrong problem. With automatic downtime tracking, every state change on the PLC is recorded as a timed interval, with the product that was running and the fault code where the PLC reports one.
During these two weeks, have a supervisor classify the larger stops against a short reason list each day. Ten minutes a shift is enough.
Days 15–17: find where the time goes
Now look at the record. Three views answer most questions:
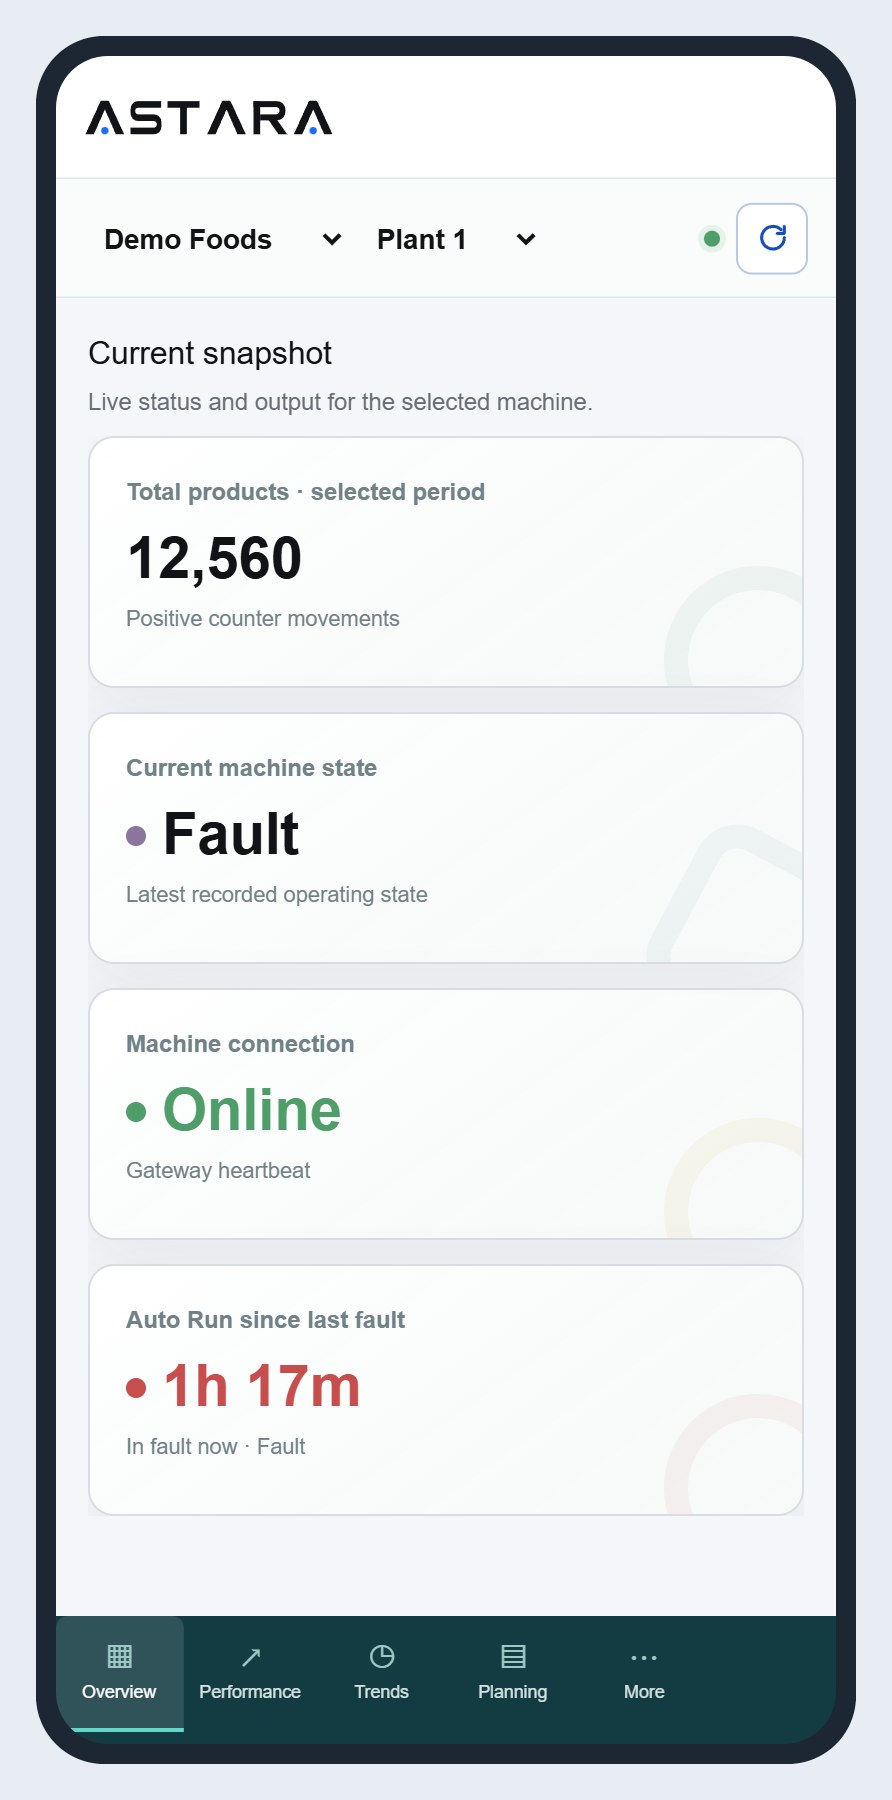
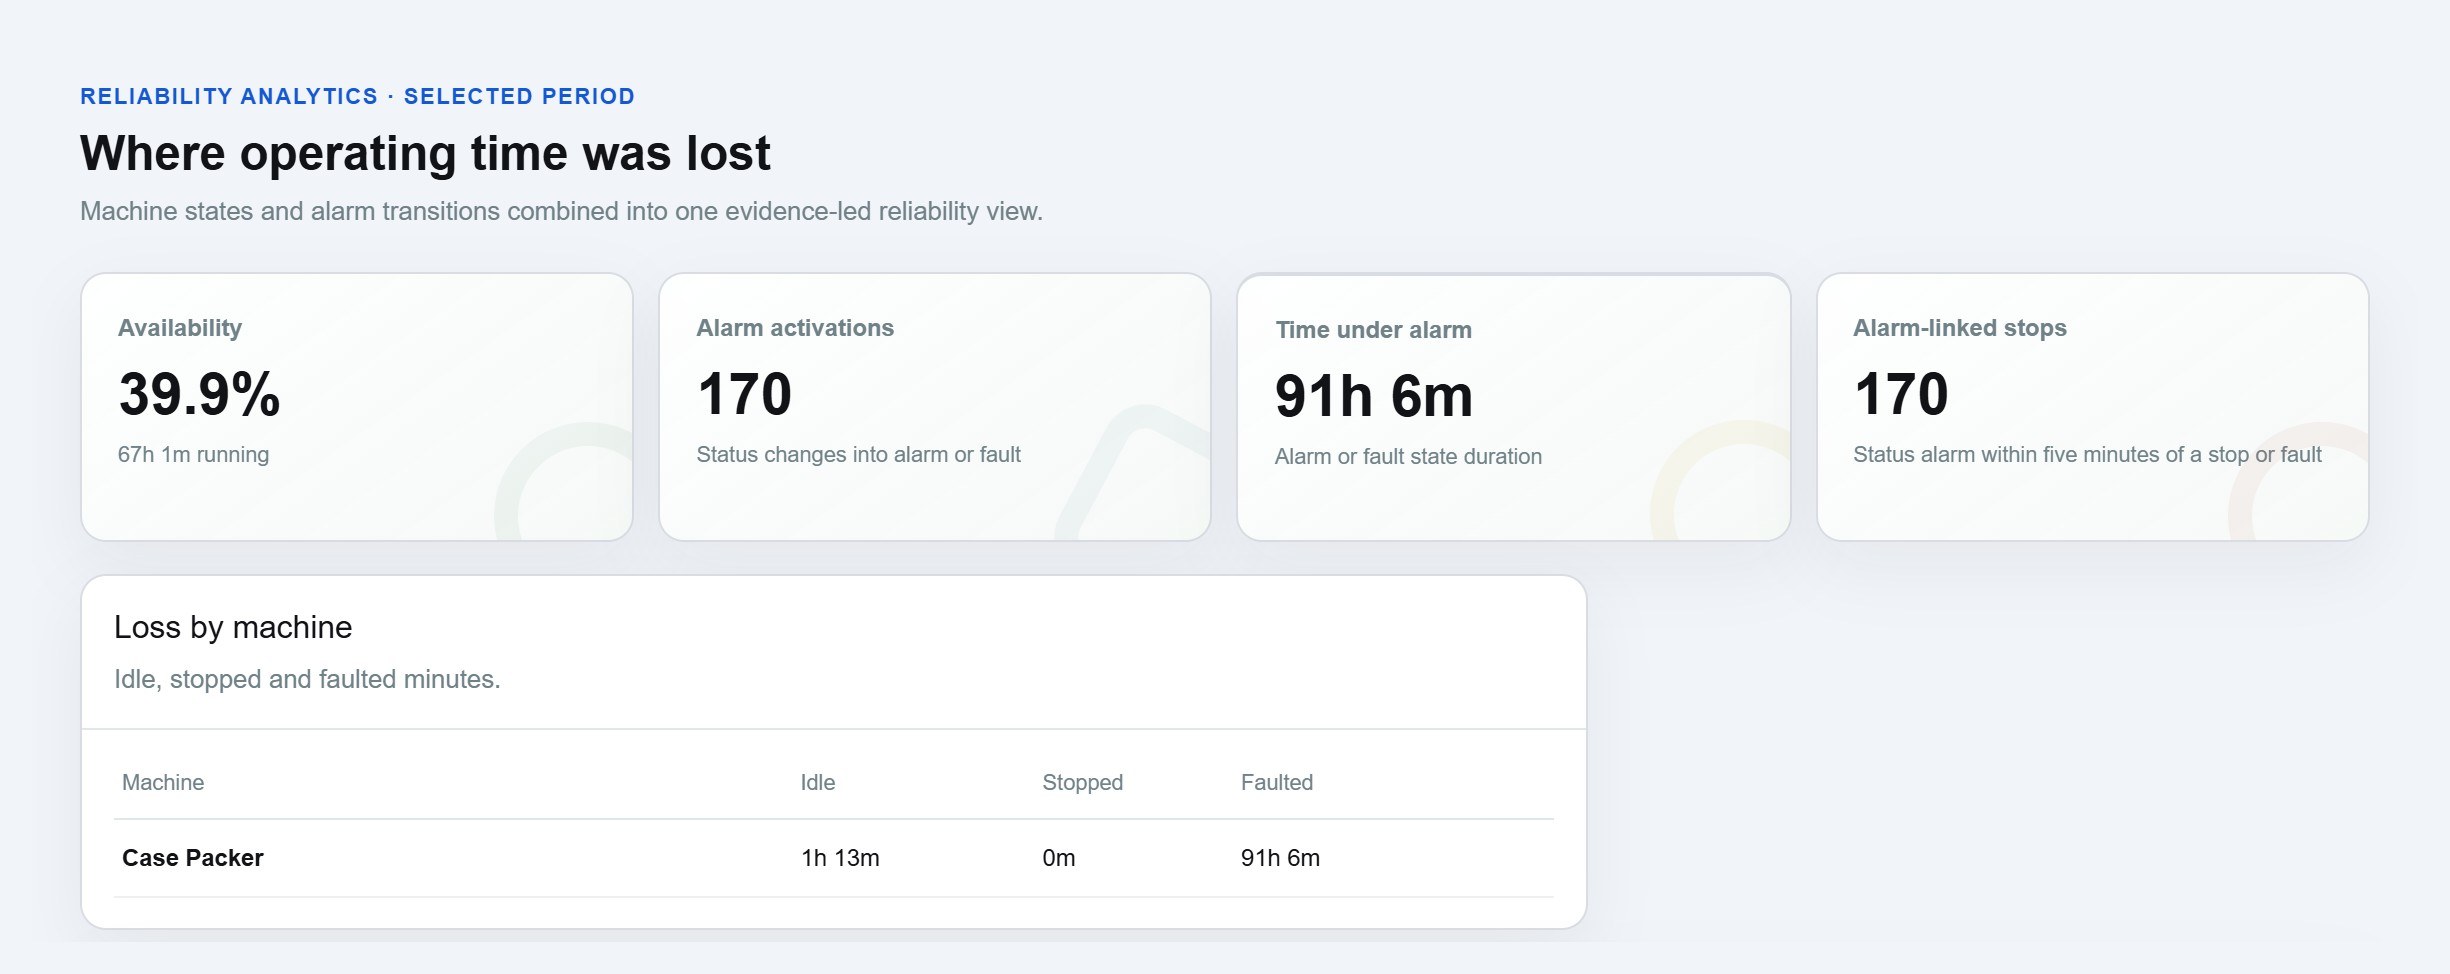
- Time by machine state. How much of the scheduled time was the machine actually in Auto Run? How much was idle (ready but starved or blocked), fault, stopped or offline?
- Faults ranked by lost time, not by count. Ten five-second faults matter less than one forty-minute fault, but forty two-minute faults can beat both.
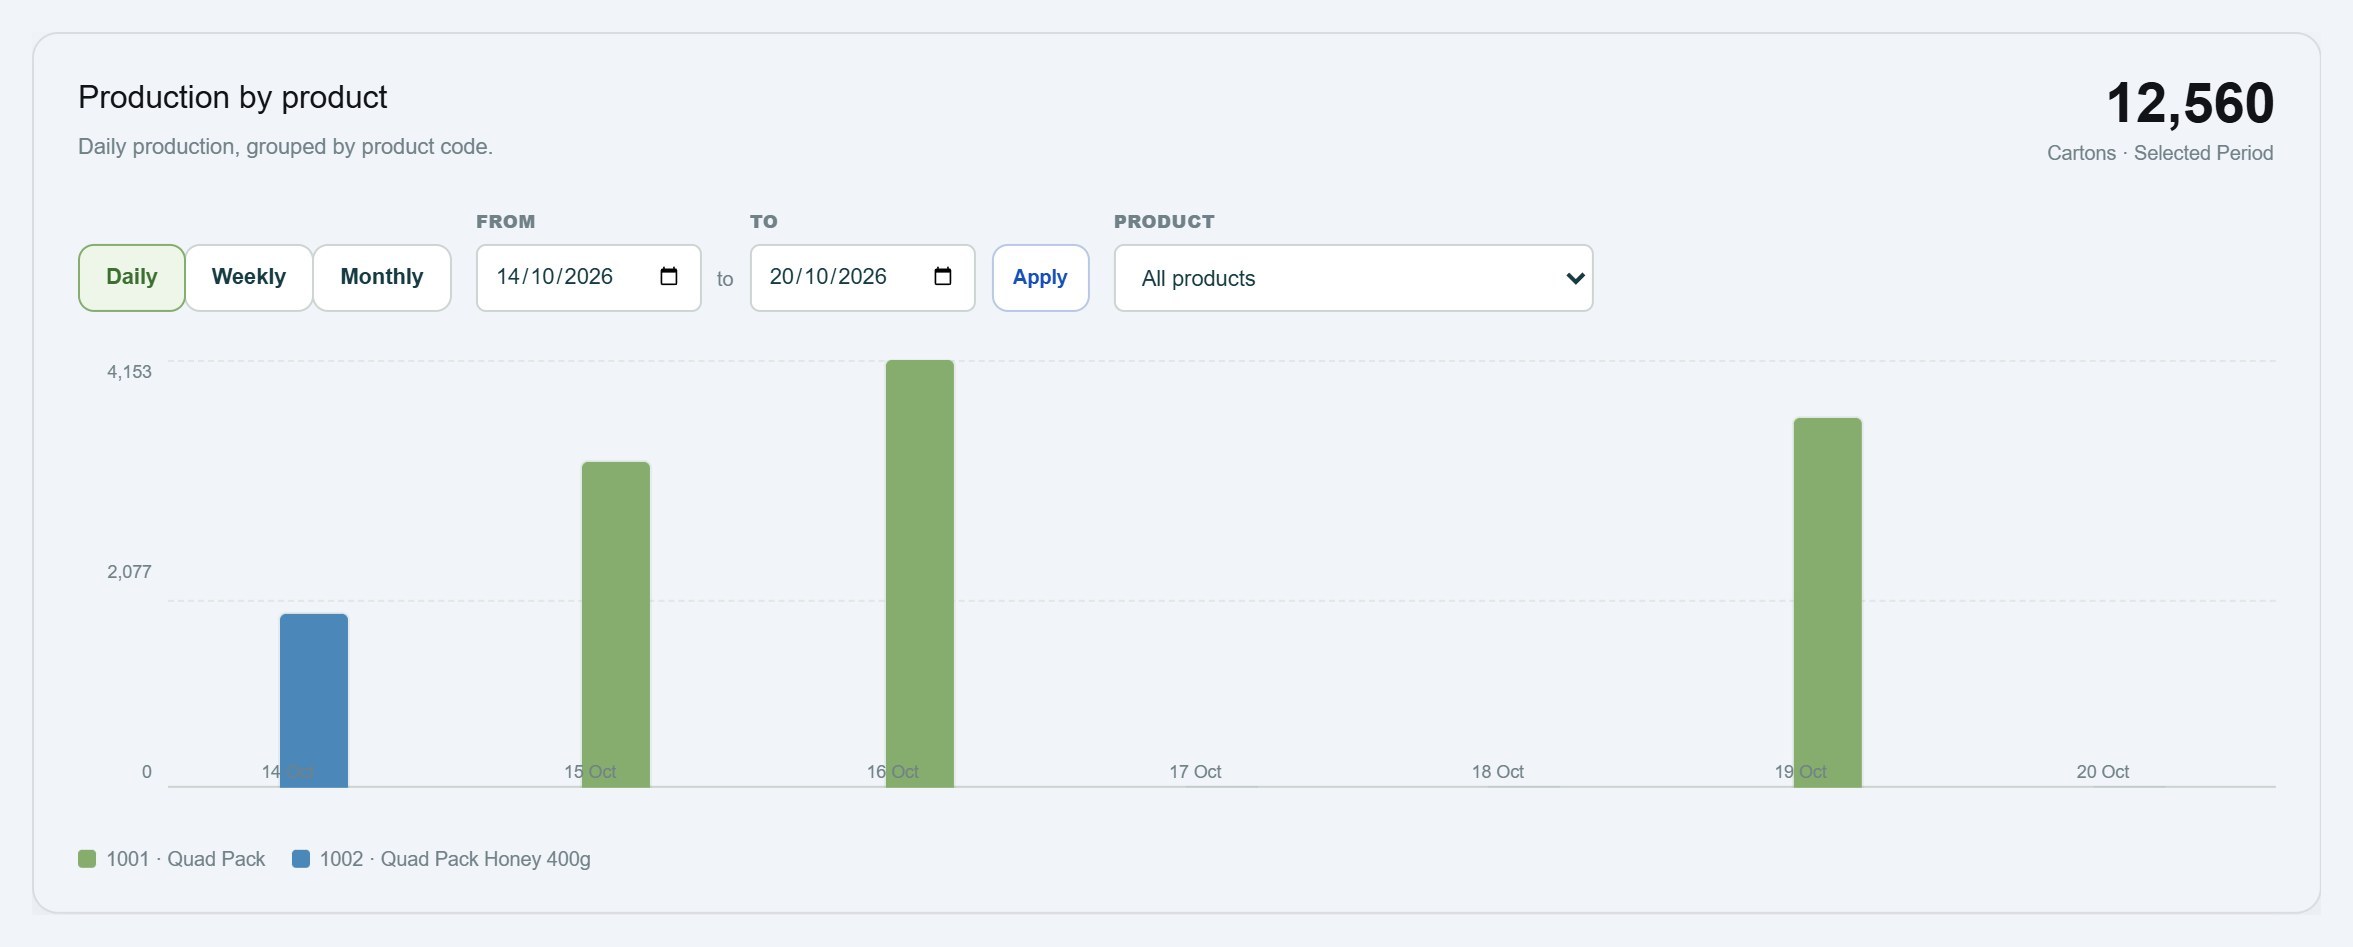
- Production by 15-minute interval, which shows micro-stops and slow running that never appear as a stop at all.
Expect a surprise. In many plants the biggest loss isn't a breakdown. It is idle time: a machine ready to run but waiting for product, packaging, an operator or a downstream machine.
Days 18–25: fix the biggest loss, and only that
Take the single largest loss and go after its root cause with the people who run and maintain the machine. Some typical patterns:
- Repeated short faults on one sensor or station: adjustment, cleaning or replacing a worn part.
- Long changeovers: standardise the sequence, prepare parts before the line stops, and agree a target time.
- Idle time waiting for materials: fix the supply of cartons, film or labels to the line, which is often a scheduling problem rather than an engineering one.
- Starts after breaks: stagger breaks so the constraint keeps running.
Change one thing at a time. If you change three, you won't know which one worked.
Days 26–30: prove it
Compare the week after the change with the baseline, using the same views. Look at Auto Run time, the count and duration of the fault you targeted, and mean time between faults. Astara's Overview compares any period with the one before it, which makes this a quick check rather than a spreadsheet exercise.
If the improvement is real, make it standard. Then go back to the record, take the next biggest loss and start again.
Where OEE fits
Overall equipment effectiveness (OEE) multiplies availability, performance and quality into one figure. It is a useful summary, but a single OEE score won't tell you what to fix, and if quality isn't measured it overstates what you know. For a downtime programme, the availability and performance evidence underneath OEE is what drives action. Read more on our OEE page.
Keep it running after day 30
- Review the downtime record weekly, in the production meeting, with the weekly report on screen.
- Keep the reason list short and review it each quarter.
- Extend measurement to the next machine on the line once the first one is under control.
Astara gives small and mid-sized manufacturers the measurement half of this plan: automatic stops from the PLC, fault codes, reasons, and dashboards your team will actually open. Start with one machine.