Downtime on food and packaging lines: where the minutes go
Where food and packaging lines really lose time (changeovers, micro-stops, starved machines, cleaning and faults) and how machine monitoring shows each loss so you can reduce it.
Food and packaging lines lose time in ways that are easy to underestimate. A big breakdown gets noticed, discussed and fixed. The losses that quietly take an hour or more a shift are harder to see: two-minute jams, a filler waiting for jars, a changeover that runs long every Tuesday. This article looks at where the minutes really go on food and packaging lines, and how machine monitoring makes each loss visible.
1. Changeovers
Food and packaging plants run many SKUs: different pack sizes, flavours, labels and customers. Every change means stopping, swapping parts, adjusting guides, loading new packaging and running until the product is right. With several changeovers a shift, this is often the largest planned loss on the line.
What to measure: the stop between the last good count of one product code and the first steady running of the next. When the PLC reports the product code, every changeover is timed automatically and can be compared by product pair, shift and crew.
2. Micro-stops
Short stops of seconds to a few minutes: a carton that didn't open, a label that misfed, a jar that fell on the infeed. Each is trivial; together they can be the biggest loss on a high-speed line. They are also the losses manual logs miss almost entirely.
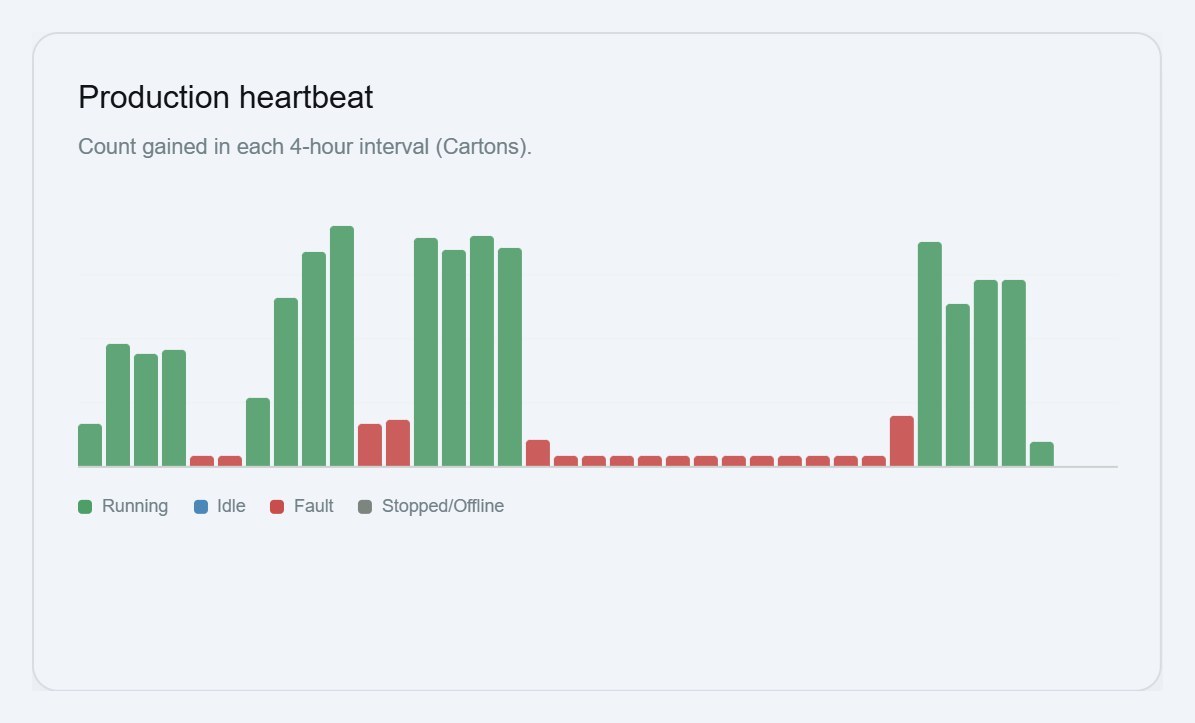
What to measure: fault count, total fault time and mean time between faults, with the PLC's own alarm code for each stop. A production heartbeat (output per 15 minutes) shows where micro-stops cluster.
3. Starved and blocked machines
On a linked line, a machine is often ready to run but has nothing to work on (starved) or nowhere to send product (blocked). The machine isn't faulted, so it may not raise an alarm, but output still stops.
What to measure: idle time, separately from fault and stopped time. A filler that spends 15% of its shift idle is telling you about the upstream process, materials supply or the downstream case packer, not about itself.
4. Cleaning and sanitation
Food safety requires regular cleaning, often scheduled between products and at the end of production. It is necessary time, but it should be planned, consistent and measured. Cleaning that takes 40 minutes on one shift and 70 on another is an opportunity.
What to measure: classify cleaning stops with a reason code so they can be tracked against the standard time.
5. Breakdowns
Mechanical and electrical failures that need maintenance. They are less frequent than the losses above but individually costly, especially on the line's constraint.
What to measure: fault codes and durations, ranked by lost time per machine, with mean time between faults showing whether reliability is improving.
6. Slow running
A line running at 80% of its rated speed loses as much as one stopped for a fifth of the shift, without a single stop on record. Operators sometimes slow a machine to avoid jams; that's a sign of an underlying problem worth fixing.
What to measure: production rate compared with the expected rate for each product, and output per interval.
7. Unknown time
Finally, time nobody can account for. On a whiteboard it disappears. In a monitoring system it should appear as unknown or offline, never silently counted as running or stopped, so you know how complete your record is.
Putting it together
The breakdown of a shift into Auto Run, idle, fault, stopped and offline time, alongside production by product, is the single most useful view for a food or packaging line. It shows at a glance which of these seven losses dominates, and where to start.
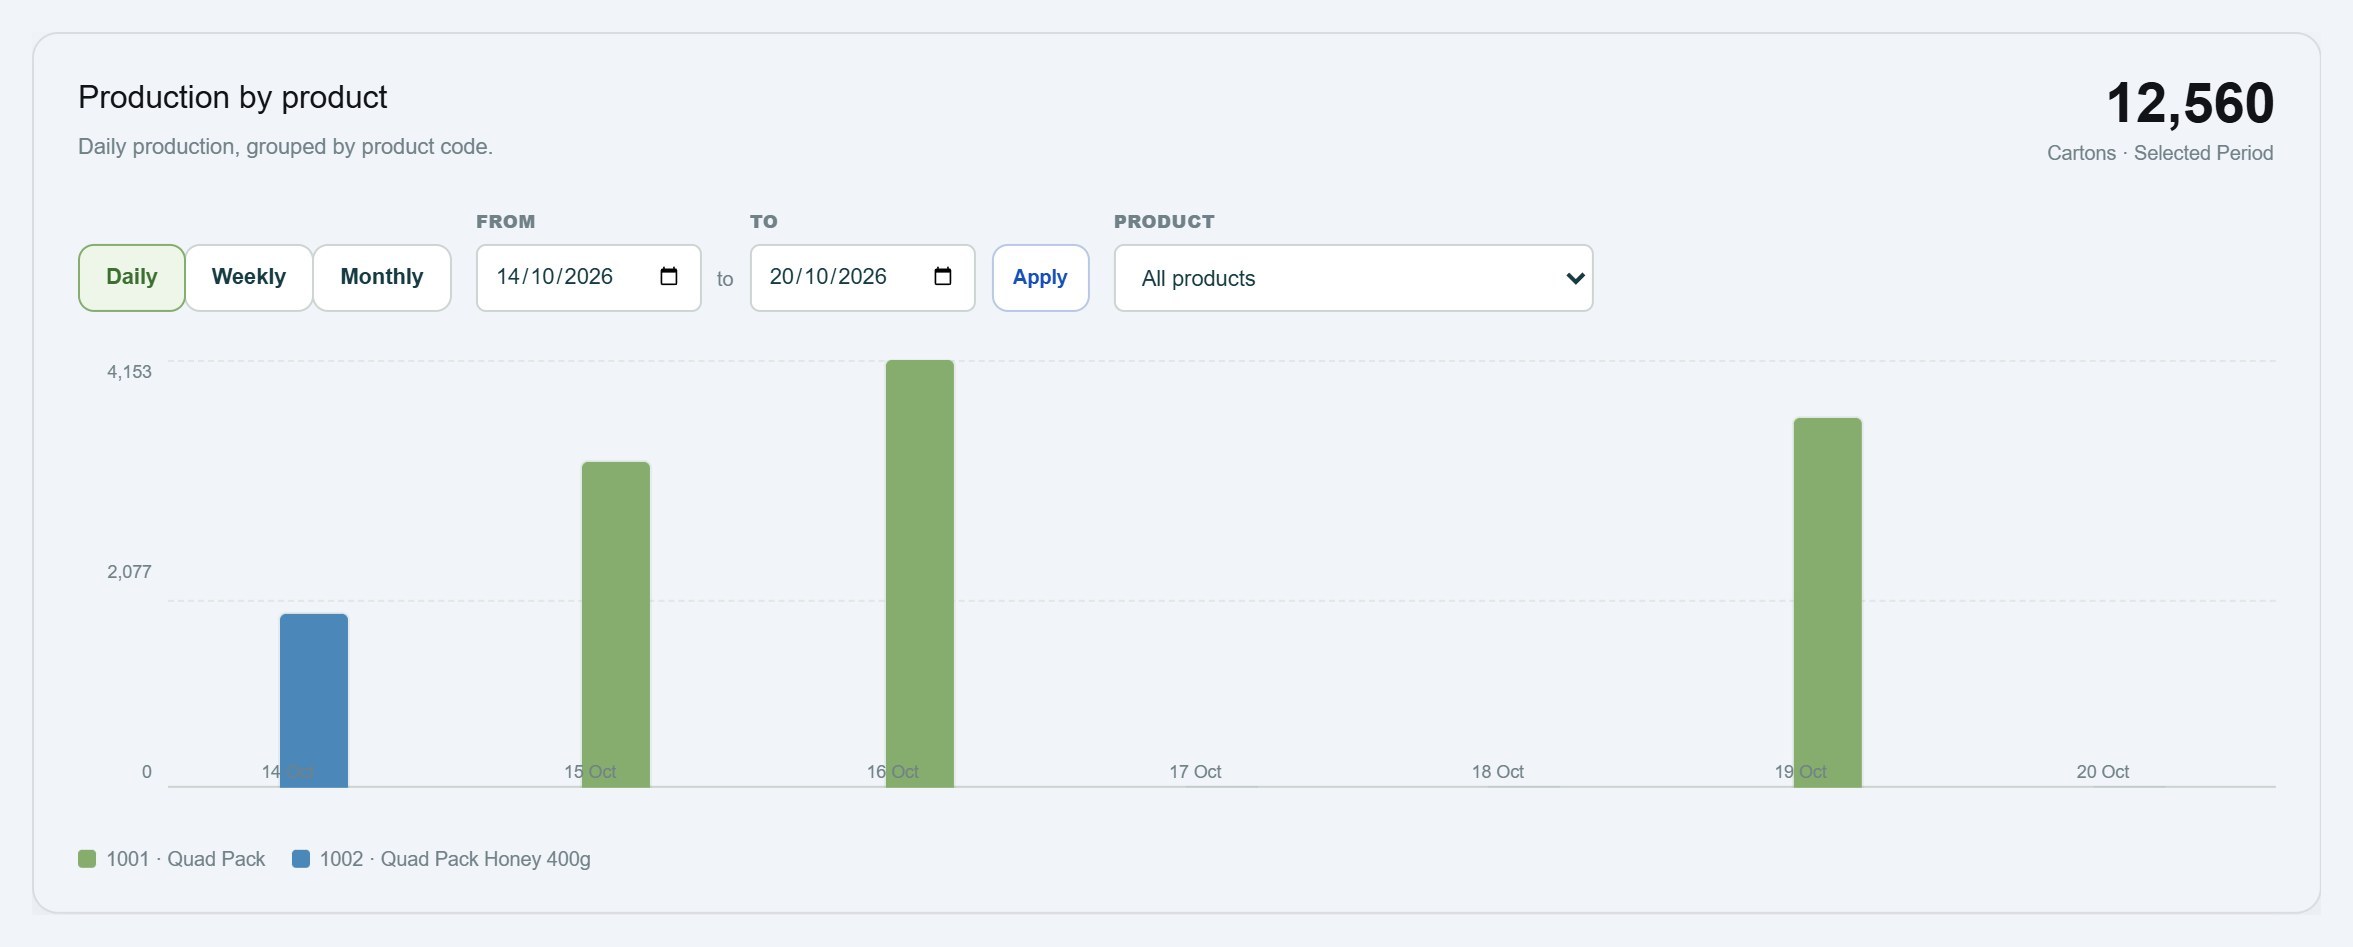
Astara was built for this. It reads machine state, product code, production count and fault code from each machine's PLC over a read-only connection, and turns them into the views above. It's designed for small and mid-sized Australian food and packaging manufacturers. Read more on our food and packaging page, see our 30-day downtime reduction plan, or contact us to start with one machine.